Debugger Environment
This chapter describes the interactions you need in order to use the debugger. Topics include the interface in general:
- working with the Debugger's windows
- accessing menus
- using dialogs
- using accelerators for faster interaction with the Debugger
as well as the windows and menus that are widely used:
- Status window
- Action menu
- Log window
- Window menu
- Help menu
- File menu
- Accelerator window
- Code menu
- Data menu
Debugger windows
The debugger displays its information in windows. You can use a mouse or the keyboard to access all the features in the user interface.
 |
In Photon, wd's windows appear as character panels in a graphical window. Don't resize the graphical window, as wd won't refresh its character panels properly. |
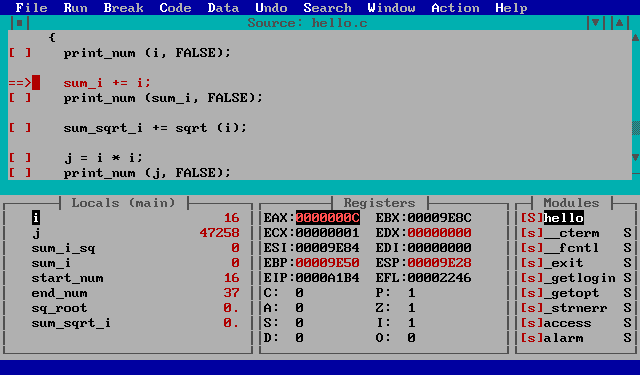
A sample of a wd window is shown below:
Window controls
Each window has the following controls:
- Minimize
- The Minimize button is the down-arrow button on the top right corner of the window. When you click onit, the window becomes an icon at the bottom of the screen.
- Maximize
- The Maximize button is the up-arrow button on the top right corner of the window. When you click on it, the window fills the whole screen.
- Restore
- The Restore button appears only when the window is maximized, replacing the Maximize button. It's an up-and-down arrow. Click on it to put the window back to its original size.
- Close
- Each window has a Close button in the top left corner. Double-click on this button to close the window.
- System menu
- The System menu
contains these items that operate on the window:
- Restore
- Move
- Size
- Minimize
- Maximize
You can activate a window's System Menu by clicking once on the close button.
- Scroll Bars
- Windows that contain information that can't fit in the window have scroll bars. Use the scroll bars to reposition the window so the information you want to see is visible. The small box in the scroll bar indicates the current scroll position in the window.
- Title
- Each window is titled so that you know what information it contains. The title appears in the bar at the top of the window.
- Buttons
- Many windows have small buttons on the left hand side. These buttons are short forms for performing the most common operations.
Current window
The current window is the one whose title bar is colored. Press Ctrl-Tab to move from window to window.
Controlling the size and location of windows
- Moving windows
- To move a window, click in the Title bar and drag it to a new location. You can also choose Move from the System Menu - use the cursor keys to reposition the window, then press Enter when the window's in the right spot.
- Resizing windows
-
Move the cursor to any corner of the
window. Hold the left mouse button down, and drag the mouse to resize
the window.
You can also choose Size from the System Menu to change the size of a window. Use the cursor keys to resize the window, and press Enter when the window is the right size.

When you use the Size command, only the right and bottom sides of the window can be moved.
- Zooming windows
- Choose Zoom from the Window menu to toggle a window between its maximized and normal sizes.
- Context-sensitive popup menus
- The debugger has context-sensitive popup menus for each window in the
application.
You can access the menu either by pressing the right
mouse button in the window or by typing the period (.) key.
You can then choose a menu item by typing the highlighted character
or by clicking on it. You can close the menu without choosing
an item by pressing Esc.
If you've memorized the highlighted menu character, you can bypass the menu and activate the menu item directly by pressing the Ctrl key in conjunction with that character. The items that appear in the menu depend on the current window. These menus are described in detail throughout this manual.

In Photon, the combinations Ctrl-C, Ctrl-H, and Ctrl-I don't work. All the other shortcuts work.

The Action item in the main menu is identical to the context-sensitive popup menu for the current window, so you can use whichever is more convenient.
- Text selection
-
Some windows, such as the Source and Assembly
windows, allow you to select text. For example, you might want to
select a variable name or expression. Menu items act on the selected
item.
You can select text with either the left or right mouse button. If you use the right button, the popup menu appears when you release the button. With the keyboard, hold Shift while using the cursor keys. You can select a single character, and the debugger automatically extends the selection to include the entire surrounding word.

You can use the Shift key to select text only if wd is running on a console device.
Menus
You'll find a number of menu items at the top of the debugger window. You can select a menu item with the mouse, or with the Alt key and the highlighted character from the menu title. Use the cursor keys to move between menus and menu items. To select an item, press Enter; to close a menu without choosing an item, press Esc.
Many menu items have accelerators or keyboard equivalents. They appear to the right of the menu item. As you learn the debugger, take time to learn the accelerators - they'll help you use the debugger more effectively.
Dialogs
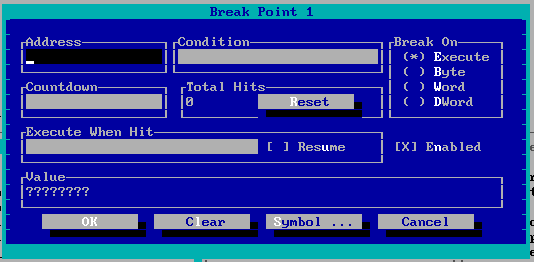
Dialogs appear when you choose a menu item that doesn't perform an immediate action. They allow you to make choices and set options. To give focus to an item in a dialog, click on it, or use Tab or Shift-Tab to move to it. The dialogs contain the following:
- Edit fields
- These are fields in which you can type information.
- Buttons
- You can click on buttons to perform actions. The keyboard shortcut for the button is highlighted.
- Default button
- The default button in a dialog is highlighted. You can select this button by pressing Enter.
- Cancel
- All dialogs contain a cancel button. Choose the Cancel button or press Esc to leave a dialog without saving or implementing the changes you've made to the dialog.
- Check Boxes
- Check boxes are used to control settings in the debugger. Press Space to toggle the option between on and off.
- Radio Buttons
- Radio buttons are a group of check boxes. Use the cursor keys to move to a button to turn it on. One radio button must be on at all times. When you click on one, the others in the group are turned off.
- List boxes
- A list box contains a list of applicable items.
- Drop-down List boxes
- A drop-down list box is a list that doesn't appear on the screen until you click on the down arrow on the right of the box. You may then select from a list of options.
Accelerators
Accelerators are keys that you can press instead of selecting a menu item or typing commands. The debugger comes with a standard set of accelerators that you can view by choosing Accelerators from the Window menu.
If you're used to the CodeView debugger, you should be comfortable with the Watcom Debugger's default set of accelerators. If you're used to using Turbo Debugger, you can select accelerators that are similar to its accelerator definitions. To select Turbo accelerators, choose Accelerator from the Window menu, then select TD Keys from the Action menu.
Default Accelerators
| Accelerator | Equivalent command |
|---|---|
| / | Search/Find... |
| CTRL-\ | Search/Next (see note below) |
| ? | add a new expression to the Watch window |
| F1 | invoke the Help facility |
| F2 | Data/Registers |
| F3 | toggle between source level and assembly level debugging |
| F4 | Window/Application |
| F5 | Run/Go |
| F6 | Window/Next |
| F8 | Run/Trace Into |
| F9 | Break/Toggle |
| F10 | Run/Step Over |
| SHIFT-F9 | add a new item to the watch window |
| CTRL-F4 | close the current window |
| CTRL-F5 | restore the current window to its normal size |
| CTRL-F6 | rotate the current window |
| CTRL-F9 | minimize the current window |
| CTRL-F10 | maximize the current window |
| ALT-F10 | display the floating popup menu for the current window |
| CTRL-TAB | rotate the current window |
| CTRL-LEFT | Undo/Undo |
| CTRL-RIGHT | Undo/Redo |
| CTRL-UP | Undo/Unwind Stack |
| CTRL-DOWN | Undo/Rewind Stack |
| CTRL-BACKSPACE | Undo/Home |
| ALT-1 | Data/Locals |
| ALT-2 | Data/Watches |
| ALT-3 | Code/Source |
| ALT-4 | File/View... |
| ALT-5 | Data/Memory at... |
| ALT-6 | Data/Memory at... |
| ALT-7 | Data/Registers |
| ALT-8 | Data/80x87 FPU |
| ALT-9 | File/Command... |
| CTRL-z | Window/Zoom |
| SPACE | Run/Step Over |
| . | display the floating popup menu for the current window |
| : | File/Command... |
| = | Search/Match |
| n | Search/Next |
| N | Search/Previous |
| u | Undo/Undo |
| U | Undo/Redo |
| b | Break/At Cursor |
| e | Data/Memory at... |
| g | Run/Execute to... |
| h | move cursor left one |
| i | Run/Trace Into |
| j | move cursor down one |
| k | move cursor up one |
| l | move cursor right one |
| t | Break/Toggle |
| x | Run/Next Sequential |
 |
Don't use the CTRL-\ accelerator in a pterm window; it kills wd. |
Turbo Emulation Accelerators
| Accelerator | Equivalent command |
|---|---|
| F2 | Break/Toggle |
| F3 | Code/Modules |
| F4 | Run/Run to Cursor |
| F5 | Window/Zoom |
| F6 | Window/Next |
| F7 | Run/Trace Into |
| F8 | Run/Step Over |
| F9 | Run/Go |
| ALT-F2 | Break/New... |
| ALT-F3 | close the current window |
| ALT-F4 | Undo/Undo |
| ALT-F5 | Window/Application |
| ALT-F7 | trace one assembly instruction |
| ALT-F8 | Run/Until Return |
| ALT-F9 | Run/Execute to... |
| ALT-F10 | activate the popup menu for the current window |
| CTRL-F2 | Run/Restart |
| CTRL-F4 | open a new watch window |
| CTRL-F7 | add a new item to the watch window |
Status window
The Status window appears at the bottom of the debugger screen. As you drag the mouse over a menu item, descriptive text about that menu item appears in the status window. Messages about the current status of the program and debugger warning messages also appear in the status window.
Action menu
Most windows in the debugger have a context-sensitive popup menu. The Action menu contains the same menu items as the current window's popup menu. It may be used as an alternative to the popup menus. Instead of selecting text with the right mouse button and using the popup menu, you can select text with the left mouse button or keyboard and use the Action menu.
Log window
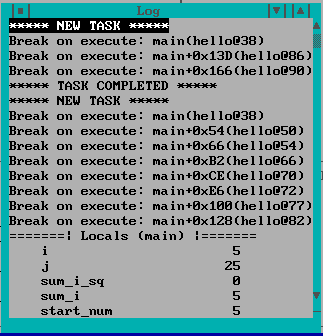
Choose Log from then Data menu to see the Log Window. The Log Window displays several different types of messages, including:
- status messages such as breakpoint notification
- warning and error messages
- output from debugger commands
You can send the contents of any window to the log window by selecting To Log from the Window menu. You can then review the information later.
Window menu
The Window menu allows you to control and arrange the windows on your screen.
The Window menu contains the following items:
- Application
- Switch to the output screen of the application. Press any key to return to the debugger.
- To Log
- Save the current window's contents to the log window. Open the Log Window to see the contents.
- To File
- Save the contents of the current window to a file. You must enter a filename and choose the directory in which you want to save the information. This is useful for comparing the program state between debugging sessions.
- Zoom
- Change the size of the current window. Zoom toggles the current window between its normal and maximum sizes.
- Next
- Rotate through the windows, choosing a new current window.
- Accelerator
- Open the Accelerator window. This window allows you to inspect and modify the debugger's keyboard shortcut keys.
This menu also contains a list of the wd windows. Choose a window to give it focus; a check mark indicates which window currently has focus.
Help menu
The Help menu contains the following items that let you use the online help facility:
- Contents
- Show the main table of contents of the online help information. This is equivalent to pressing F1.
- About
- Display the copyright and version information for the debugger.
File menu
The File menu contains items that allow you to perform these file operations:
- Open
- Start debugging a new program, or to restart the current program with new arguments.
- View
- Display a file in a window.
- Command
- Enter a debugger command. For a description of debugger commands, refer to Appendix A: Debugger Commands.
- Options
- Set the global debugging options. For a full description of these options, refer to the section ``Options dialog.''
- Window Options
- Set the options for the debugger's various windows. For a full description of these options, refer to the section ``Window options dialog.''
- Save Setup
- Save the debugger's current configuration. This saves the positions
and sizes of all windows as well as all options and settings.
By default, this information is saved in the file
setup.dbg,
but you can save this information in another file to
create alternate debugger configurations. If you want to save
the file in a directory other than the one displayed, type its
pathname in the File Name field.
For more information on configuration files, see the section ``Customizing the Watcom Debugger'' in the chapter Starting Up the Debugger.
- Load Setup
- Load a configuration previously saved using Save Setup.
- Source Path
- Modify the list of directories that are searched when the debugger is searching for source code files.
- System
- Spawn a new operating system shell.

If you need another shell, you can also switch consoles in character-mode, or open a new pterm window in Photon.
- Exit
- Close the debugger.
Options dialog
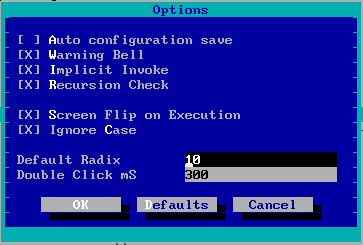
The Options dialog allows you to change the following settings:
- Auto configuration save
- When this option is on, the debugger automatically saves its configuration on exiting.
- Warning Bell
- When this option is on, the debugger beeps when a warning or error is issued.
- Implicit Invoke
- If this option is on, the debugger treats an unknown command as
the name of a command file and automatically tries to invoke it. If this
option is off, you must use the
Invoke command to invoke a command
file.

Under QNX, a conflict is possible when Invoke is on. A path specified for a command filename is confused with the short form of the DO command (/).
- Recursion Check
- Use this option to control the way tracing over recursive function calls is handled. When this option is on, and you trace over a function call, the debugger won't stop if the function executes recursively.
- Screen flip on execution
- Use this option to control whether the debugger automatically flips the display to the application's screen upon execution.
- Ignore case
- This option controls whether case is ignored or respected when the debugger is searching for a string.
- Default Radix
- Use this option to define the default radix used by the debugger. The debugger associates a radix with each action automatically. For example, if you're asked to enter an address, the debugger assumes base 16. If you double-click on a decimal value, you're prompted for a decimal replacement value, but there are occasions when the debugger must use the default radix. If you add an arbitrary expression to the Watches window, the default radix is used when interpreting that expression. You can specify any radix from 2 to 36, inclusive.
- Double click mS
- This option sets the amount of time in milliseconds allowed between two clicks for the debugger to accept it as a double click. Enter a larger value if you're having trouble with double clicks.
Window options dialog
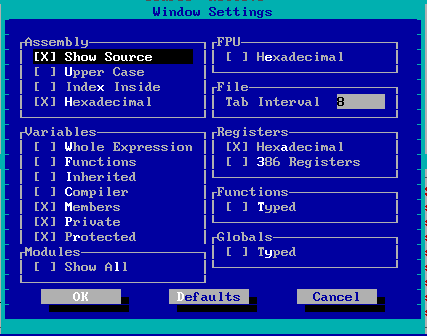
Use the Window Options dialog to define options related to the debugger's various windows. All of these options appear in a dialog when you choose Window Options from the File menu.
The Window Options dialog allows you to set options for the following windows:
- Assembly
- Local
- Variable
- Watch
- 80x87 FPU
- Source
- Registers
- Functions
- Globals
- Modules
Assembly options
The Assembly options allow you to define how your assembly code appears. You can set the following options:
- Show Source
- Turn on this option if you want source code intermixed with assembly code.
- Upper Case
- Turn on this option if you want instructions and operands to appear in upper case.
- Index Inside
- Turn on this option to display an alternate form of indexing. -4[bp] is displayed as [bp-4].
- Hexadecimal
- Turn on this option if you want immediate operands and values to be displayed in hexadecimal.
Variables options
Use the Variable options to set display options and to specify which members of a class you want displayed when a structure or class is expanded. You can set:
- Whole Expression
- Turn this option on to show the whole expression used to access fields and array elements instead of just the element number or field name itself.
- Functions
- Display C++ member functions in expanded classes.
- Inherited
- Display inherited members in expanded classes.
- Compiler
- Display the compiler-generated members. You won't usually want this option turned on.
- Members
- Display members of the C++ this pointer as if they were local variables declared within the member function.
- Private
- Display private members in expanded classes.
- Protected
- Display protected members in expanded classes.
FPU options
Turn on the hexadecimal option to display the floating-point registers in raw 10-byte hexadecimal format instead of the usual floating-point notation.
File options
You can set the display width of a tab in the File options section. This value defaults to 8 spaces.
Registers options
Use the Registers options to set:
- Hexadecimal
- Turn this option on to display the register values in hexadecimal instead of decimal.
- 386 Registers
- Turn this option on if you're debugging a 16-bit application and want to see the full 32-bit register set.
Functions and Globals options
For both Functions and Global Variables windows, you can turn on the Typed symbols option. This restricts the list of symbols to those defined in modules compiled with full debugging information (d2 option).
Modules options
You can turn on Show All to allow the modules window to display all modules in your program, not just those that have been compiled with the d2 option.
Accelerator window
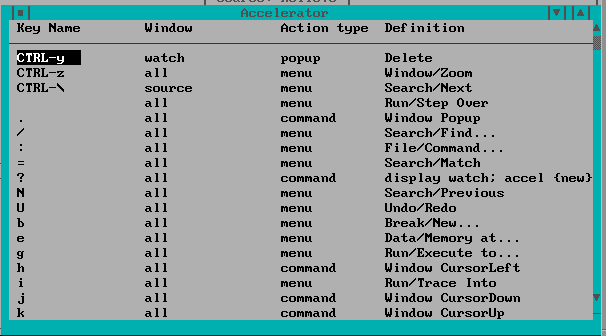
The Accelerator window allows you to control the accelerators or keyboard equivalents used by the debugger. Choose Accelerator from the Window menu to open this window. The window displays four items relating to each accelerator definition:
- key name
- window to which the accelerator applies
- type of action that the accelerator defines
- specifics of that action.
Accelerators may apply either to all windows or to a specific window. You could define F2 to perform a different action depending upon which window is current. Accelerators that apply to all windows have a window type of all.
An accelerator can define one of three action types:
- popup
- Activate a popup menu item in the current window.
- menu
- Activate an item from the main menu.
- command
- Perform an arbitrary debugger command.
You can modify an element of an accelerator definition by double-clicking on it, or by cursoring to it and pressing Enter. Press the right mouse button to access the following menu items:
- Modify
- Change the currently selected element of an accelerator assignment:
- If the key name is selected, you're prompted to type a new key.
- If the window name is selected, you're presented with a list of possible window classes.
- If the action type or details are selected, you're presented with a menu in order to pick the menu item that's attached to the accelerator.
- New
- Add a new accelerator assignment. You'll be prompted for all details.
- Delete
- Delete the selected accelerator.
- TD Keys
- Use an approximation of Borland Turbo Debugger's accelerators.
- WD Keys
- Use the default set of accelerators. If you're familiar with CodeView, you'll be comfortable with these key assignments.
Code menu
The Code menu allows you to display windows that show different information related to your code:
- Source
- Open the source window. It shows source code at the currently executing location. See the section ``Source Window'' in the Navigating Through a Program chapter.
- Modules
- Display a sorted list of modules contained in the current program. See the section ``Modules Window'' in the Navigating Through a Program chapter.
- Functions
- Open a sorted list of all functions in the program. See the section ``Functions Window'' in the Navigating Through a Program chapter.
- Calls
- Open the call history window. This window displays the program's call stack. See the section ``Calls Window'' in the Controlling Program Execution chapter.
- Assembly
- Open the assembly window. It shows assembly code at the currently executing location. See the section ``Assembly Window'' in the Assembly-level Debugging chapter.
- Threads
- Open a list of all threads in your program and their current state. See the section ``Threads Window'' in the Controlling Program Execution chapter.
- Images
- Open a list of the executable images that are related to the program being debugged. This includes a list of all loaded shared libraries and Dynamic Link Libraries (DLLs). See the section ``Images Window'' in the Navigating Through a Program chapter.
- Replay
- Open the program execution replay window. This window allows you to restart your application and replay your debugging session to any point. See the section ``Replay Window'' in the Controlling Program Execution chapter.
Data menu
The Data menu contains a number of windows that you can open to view the state of your program's data:
- Watches
- Open a watches window. You can add and delete variables from the watches window and use it to evaluate complex expressions and perform typecasting. See the section ``Variable and Watch Windows'' in the Examining and Modifying the Program State chapter.
- Locals
- Open a Locals window. It displays the local variables of the currently executing function. See the section ``Variable and Watch Windows'' in the Examining and Modifying the Program State chapter.
- File Variables
- Open a File Variables window. It contains a list of variables defined at file scope in the current module. See the section ``Variable and Watch Windows'' in the Examining and Modifying the Program State chapter.
- Globals
- Open a sorted list of all global variables in your program. Values aren't displayed (because of the overhead to update), but you can select variables from this window and add them to a Watches window. See the section ``Globals Window'' in the chapter Navigating Through a Program.
- Registers
- Displays the CPU registers and their values. See the section ``Register Window'' in the Assembly-level Debugging chapter.
- 80X87 FPU
- Displays the 8087 registers and their values. See the section ``80x87 FPU Window'' in the Assembly-level Debugging chapter.
- Stack
- Displays memory at the stack pointer. See the section ``Memory and Stack Windows'' in the Examining and Modifying the Program State chapter.
- I/O Ports
- Open a window that lets you manipulate the I/O address space of the machine. See the section ``I/O Ports Window'' in the Assembly-level Debugging chapter.
- Memory at...
- Display memory at a given address. See the section ``Memory and Stack Windows'' in the Examining and Modifying the Program State chapter.
- Log
- Displays debugger messages and the output from debugger commands. See the section ``Log Window'' in the chapter The Debugger Environment.