Navigating Through a Program
This section describes how to use the debugger to browse through your program. This involves the Search menu and the following windows:
Search menu
The Search menu allows you to search a window for a given string. It contains the following items:
- Find
- Search the current window for the first appearance of a given string.
- Next
- Find a subsequent occurrence of a search string.
- Previous
- Find a previous occurrence of a search string.
- All Modules
- This searches through the source code of all the modules contained in your program for a given string.
- Match
- Find a string in a sorted window by incremental matching. Once you select match, the text you type appears in the status window, and the window you're searching repositions itself as you type each character. Press Esc to leave this mode.
If you choose the Find or All Modules item, you're prompted for the string, as described in ``Entering search strings'' in this chapter.
Entering search strings

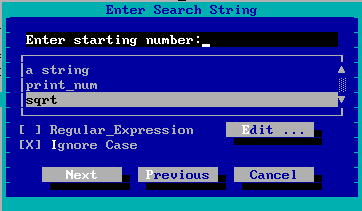
When you choose Find from the Search menu or All Modules from the Search menu, you must enter the search string you're looking for and set the parameters for the search. The Search screen consists of the following items:
- Enter Search String
- Enter the string to be found in this edit box. The larger list below shows other strings you've searched for during this debugging session. You can select these by clicking on them or by using the up and down arrow keys. The most recent search string appears at the top of the list.
- Regular Expression
- Check this box if the string is to be interpreted as a regular expression. You can click on the Edit button to edit the set of regular-expression charactersin use. For a description of regular expressions, see Appendix D: Regular Expressions.
- Ignore Case
- Check this box if you want the debugger to match the search string regardless of case.
Source window

The Source window displays your program's source code. As you trace through your program, this window scrolls to show you the current execution location. If you have an Assembly window open, the Source and Assembly windows are always positioned at the same code. If you scroll in one, the other follows.
Source lines with associated code have a button at the left of the screen. You can click on this button to set, disable, and clear breakpoints.
You can Inspect any item displayed in the source window by double-clicking on it, or by cursoring to it and pressing Enter. Press the right mouse button to access the following popup menu items:
- Inspect
- Inspect the selected item in an appropriate window. You can select function names, variable names, or any valid expression.
- Run to Cursor
- Resume program execution until the selected line is executed.
- Break
-
Add a breakpoint based on the selected text.
If a variable is selected, the program
stops when its value changes. If a function name is selected, the
program stops when that function is executed.

This doesn't set a break at the current line. Use Toggle or At Cursor in the Break menu to set a breakpoint at the current line. See the section ``Break Menu in the chapter Breakpoints.
- Enter Function
- Resume program execution until the selected function is entered.
- Watch
- Add the selected item to the Watches window for further inspection or modification.
- Find
- Search for other occurrences of the selected string in the Source window.
- Home
- Reposition the window to show the currently executing location. The cursor moves to the next line of the program to be executed.
- Show/Assembly
- Show the assembly code associated with the selected line.
- Show/Functions
- Show the list of all functions contained in the source file.
- Show/Address
- Reposition the window at a new address. You're prompted for an expression. Normally you would type a function name but you can type any expression that resolves to a code address. For example, you might type the name of a variable that contains a pointer to a function. See the chapter Expression Handling for more information.
- Show/Module
- Show the code for a different module. You're prompted for its name in a dialog. As a shortcut, you can type the beginning of a module name and click the Module... button. This displays a list of all modules that start with the text you typed.
- Show/Line
- Move to a different source line. You can also find out what line you're looking at. The edit field is initialized with the current line number.
File window
A File window is similar to a Source window except that it displays a file that isn't part of the program being debugged. Menu items related to execution, such as Break, aren't available.
Modules window

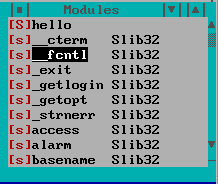
The Modules window displays a list of the modules that make up the current program. To open the Modules window, choose Modules from the Code menu.
Three items are displayed for each module:
- a button (on the left). You can click on it to see the source or assembly associated with the module. You can also double-click on the module name, or cursor to it and press Enter.
- the module name.
- the name of the image, if the module is contained in an executable image other than the one being debugged.
Since this window is sorted, Match in the Search menu can be used to find a module. Choose Match from the Search menu (or press =) and begin typing the name of the module.
Press the right mouse button to access the following popup menu items:
- Source
- Show the source code associated with the selected module.
- Assembly
- Show the assembly code associated with the selected module.
- Functions
- Show the list of all functions contained in this module.
- Break All
- Set a breakpoint at each function in this module.
- Clear All
- Delete all breakpoints that are set at addresses with this module. This doesn't affect break-on-write breakpoints.
- Show All
- Toggle between showing all modules and just modules that were compiled with full debugging information (d2). This menu item sets options on a per-window basis, overriding the global settings. When you use this menu item to change these settings, they won't be saved between debugging sessions. To change an option permanently, see the ``Window Options dialog'' in the Debugger Environment chapter.
Globals window

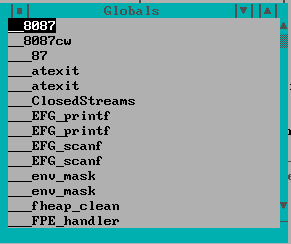
You can open the Globals window by choosing Globals from the Data menu. This window displays the names of all global variables defined in the program. To add a variable to the Watches window, double-click on it (or cursor to it and press Enter).
Press the right mouse button to access the following popup menu items:
- Watch
- Add the selected variable to the Watches window.
- Raw Memory
- Display the memory associated with the selected variable.
- Typed Symbols
- Toggle between showing all symbols and just those defined in modules compiled with the d2 option. Variables from the C/C++ library and assembly code are suppressed. This menu item sets options on a per-window basis, overriding the global settings. When you use this menu item to change these settings, they won't be saved between debugging sessions. To change an option permanently, see the ``Window Options dialog'' in the Debugger Environment chapter.
Functions window

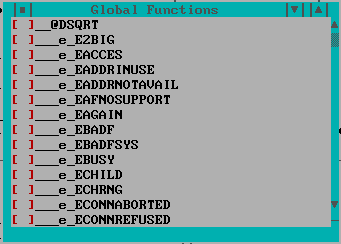
Choose Functions from the Code menu to open the Functions window. This window can display a list of all functions contained in a module, executable image, or program. To the left of each function name is a button. You can click on these buttons to set and clear breakpoints at the various functions. You can also double-click on the function name, or by cursor to a function and press Enter.
Press the right mouse button to access the following popup menu items:
- Break
- Set a breakpoint at the selected function. A dialog appears so that you can fill in detailed breakpoint information. For details, refer to the Breakpoints chapter.
- Source
- Show the source code for the selected function.
- Assembly
- Show the assembly code associated with the selected function.
- Typed Symbols
- Toggle between showing all symbols and just those defined in modules compiled with the d2 option. Variables from the C/C++ library and assembly code are suppressed. This menu item sets options on a per-window basis, overriding the global settings. When you use this menu item to change these settings, they won't be saved between debugging sessions. To change an option permanently, see the section `` The Window Options Dialog.''
Images window

Choose Images from the Code menu to open the Images window. It displays a list of executable images associated with the program that you're currently debugging. Executable images include the program executable, DLLs and QNX/Neutrino. This window displays the name of the executable image, the name of the symbolic debugging information file (if available), and the debugging information type.
Different debugging information types are generated by different compilers. Valid information types are:
- WATCOM
- This information is generated by the WATCOM compilers.
- DWARF
- This information is optionally generated by the WATCOM compilers.
To add new debugging information to an image, double-click on the image name, or cursor to it and press Enter.
Press the right mouse button to access the following popup menu items:
- New Symbols
- Add symbolic debugging information for the selected image. This is useful if you know that a separate debug information file contains the appropriate debugging information that wasn't found by the debugger.
- Delete Symbols
- Delete any symbolic debugging information associated with the selected image.
- Modules
- Show a list of modules contained in the selected image.
- Functions
- Show a list of functions contained in the selected image.
- Globals
- Show a list of all global variables contained in the selected image.